


Here are the 10 toughest U.S. cities for renters:
No. 10 Metro: Bridgeport, Conn.
 |
| No. 10 - Bridgeport, CT Photo: Getty Images |
Renter households with severe cost burdens: 30.5%
Median gross rent: $1,210
Median utilities cost for renters: $183
Median household income for renters: $38,900
Median gross rent: $1,210
Median utilities cost for renters: $183
Median household income for renters: $38,900
Per capita personal income in the Bridgeport metropolitan statistical area is the country's highest at $74,767, according to the U.S. Bureau of Economic Analysis (though most renters earn much less). The cost of living is well above average, too. Median gross rent—$1,210 in 2009—is one of the highest in the U.S., show JCHS data on the 100 largest metro areas.
No. 9 Metro: Toledo, Ohio
 |
| No. 9 - Toledo, OH Photo: Getty Images |
Renter households with severe cost burdens: 30.8%
Median gross rent: $600
Median utilities cost for renters: $140
Median household income for renters: $21,000
Median gross rent: $600
Median utilities cost for renters: $140
Median household income for renters: $21,000
Metro Toledo, near the Michigan state line in northwest Ohio, has seen employment in the manufacturing sector fall dramatically, to 37,600 in 2010, from about 62,500 jobs in 2000, according to the U.S. Bureau of Labor Statistics. The annual jobless rate in the metro area was estimated at 11.3 percent last year. In the city of Toledo, the poverty rate is 22.3 percent, according to a U.S. Census Bureau estimate for the 2005 to 2009 period. Ohio plans to spend $1.4 billion this year to spur economic development.
No. 8 Metro: Orlando
 |
| No. 8 - Orlando, FL Photo: Getty Images |
Renter households with severe cost burdens: 30.9%
Median gross rent: $970
Median utilities cost for renters: $165
Median household income for renters: $32,000
Median gross rent: $970
Median utilities cost for renters: $165
Median household income for renters: $32,000
Walt Disney (DIS), Publix Super Markets (PUSH), and Adventist Health System are major area employers, according to the Metro Orlando Economic Development Commission. The region's jobless rate was 11.4 percent last year, compared to 3.1 percent in 2000, according to U.S. Bureau of Labor Statistics estimates. From 2000 to 2009, real median rent increased by 12.8 percent, indicate data from Harvard's study.
No. 7 Metro: Memphis
 |
| No. 7 - Memphis, TN Photo: Getty Images |
Renter households with severe cost burdens: 31.6%
Median gross rent: $750
Median utilities cost for renters: $180
Median household income for renters: $25,000
Median gross rent: $750
Median utilities cost for renters: $180
Median household income for renters: $25,000
The poverty rate was 18.4 percent in metro Memphis in 2009 and 24.2 percent in the city of Memphis, according to U.S. Census Bureau data. Real median household income in Memphis fell by 19.4 percent from 2000 to 2009, according to estimates from Harvard's study.
No. 6 Metro: Akron, Ohio
 |
| No. 6 - Akron, OH Photo: Getty Images |
Renter households with severe cost burdens: 31.8%
Median gross rent: $740
Median utilities cost for renters: $160
Median household income for renters: $26,100
Median gross rent: $740
Median utilities cost for renters: $160
Median household income for renters: $26,100
Census data show that the populations of Akron city and Summit County have both decreased in the past 10 years. Meanwhile, the area's economy has grown little, with real gross domestic product increasing by only 5.2 percent from 2001 to 2009, according to figures from the U.S. Bureau of Economic Analysis. Harvard's study estimates that real median household income in the metro declined by 14.9 percent from 2000 to 2009.
No. 5 Metro: New Orleans
 |
| No. 5 - New Orleans, LA Photo: Getty Images |
Renter households with severe cost burdens: 31.8%
Median gross rent: $870
Median utilities cost for renters: $160
Median household income for renters: $28,400
Median gross rent: $870
Median utilities cost for renters: $160
Median household income for renters: $28,400
The New Orleans economy stagnated over the last decade and the area's population shrank in the wake of the devastation wrought in 2005 by Hurricane Katrina. The metro area population in 2009 was 13.8 percent below its 2000 level, show U.S. Census Bureau data. Real GDP was slightly below 2001 levels, according to data from the U.S. Bureau of Economic Analysis.
No. 4 Metro: New Haven
 |
| No. 4 - New Haven, CT Photo: Getty Images |
Renter households with severe cost burdens: 32.7%
Median gross rent: $1,000
Median utilities cost for renters: $180
Median household income for renters: $29,100
Median gross rent: $1,000
Median utilities cost for renters: $180
Median household income for renters: $29,100
The city of New Haven has Connecticut's second-highest poverty rate, at 26.7 percent, after Hartford. The shortage of units available for subsidized rental in the city, together with diminishing federal and state funding for subsidized rentals, have challenged renters, according to the city of New Haven's 2009-2010 annual action plan.
No. 3 Metro: Detroit
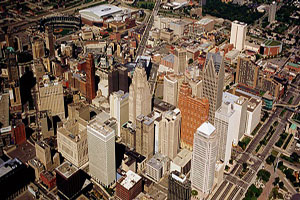 |
| No. 3 - Detroit, MI Photo: Getty Images |
Renter households with severe cost burdens: 32.8%
Median gross rent: $760
Median utilities cost for renters: $140
Median household income for renters: $25,000
Median gross rent: $760
Median utilities cost for renters: $140
Median household income for renters: $25,000
While the apartment vacancy rate in Detroit is high, renting remains unaffordable to the area's large low-income population. The poverty rate was 33.2 percent in the city of Detroit and about 14.2 percent in metro Detroit, according to a U.S. Census Bureau estimate for 2005 to 2009. Median household income in the metro area was $52,954, according to the Census Bureau.
No. 2 Metro: McAllen, Tex.
 |
| No. 2 - McAllen, TX Photo: Bloomberg |
Renter households with severe cost burdens: 33.1%
Median gross rent: $565
Median utilities cost for renters: $160
Median household income for renters: $16,200
Median gross rent: $565
Median utilities cost for renters: $160
Median household income for renters: $16,200
The McAllen metro area in the southern tip of Texas has a poverty rate of 36 percent and per capita income of just $13,130, according to U.S. Census Bureau estimates for 2005 to 2009. The annual unemployment rate was about 11.8 percent in 2010, up from 10.5 percent in 2009, according to estimates from the U.S. Bureau of Labor Statistics.
No. 1 Metro: Miami
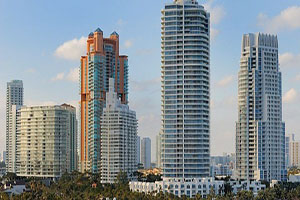 |
| No. 1 - Miami, FL Photo: Getty Images |
Renter households with severe cost burdens: 34.2%
Median gross rent: $1,040
Median utilities cost for renters: $130
Median household income for renters: $31,900
Median gross rent: $1,040
Median utilities cost for renters: $130
Median household income for renters: $31,900
Expenditures for rent in Miami-Dade County gradually rose from 16.4 percent of income in 1980 to 22.6 percent in 2000, according to a report by the Miami-Dade County Planning and Zoning Dept. The increase in rent levels subsequently gathered steam so that by 2006, the average renter was spending more than 27 percent of income on gross rent. The share of renters in the county spending more than 30 percent of household income on housing rose, from 47.1 percent in 2000 to 64.5 percent in 2006, the report states.
Sumber : Yahoo Real Estate
Jangan Lupa Click iklan dibawah ni sebagai tanda sokongan


0 comments:
Post a Comment